By Hiran de Silva
Voiceover Script
Most spreadsheets in the world live alone.
A spreadsheet is created.
Data is imported.
The analyst cleans it, reshapes it, joins it with other data.
Reports appear.
Charts appear.
Dashboards appear.
And once the work is done…
the spreadsheet is emailed.
Colleagues receive it.
They modify it.
They save their own version.
Soon there are dozens of files.
Then hundreds.
Each one slightly different.
Each one evolving in its own direction.
Files named:
Final.xlsx
Final_v2.xlsx
Final_UseThisOne.xlsx
Final_Final.xlsx
Every organization recognizes this pattern.
Thousands… sometimes tens of thousands… of spreadsheets.
Separate.
Siloed.
Each one its own little ecosystem.
And collaboration happens by emailing files back and forth.
This is the world that critics point to when they talk about
“Spreadsheet Hell.”
But what if spreadsheets didn’t have to work this way?
What if the spreadsheet was not the container of the data,
but simply the window into the data?
Let me show you a completely different world.
Imagine a multinational company.
Four hundred bicycle shops around the world.
Fifty countries.
Ninety cities.
Four regions:
Europe
Asia
Africa
The Americas.
Each shop has a manager.
Each manager is responsible for a budget.
Above them are regional managers, country managers, and group management.
Now every month something happens.
The accounts are published.
And immediately the questions begin.
Managers look at the numbers and say:
“That can’t be right.”
“We didn’t make a loss this month.”
“Where did that cost come from?”
“Prove it.”
This is a universal problem.
Because the first time most managers see the numbers…
is after they are published.
By that time it is already too late.
And the numbers themselves can easily be misleading.
Accounting requires that revenues and costs are matched in the same period.
But if a cost appears in April while the sale was recorded in March,
then March shows a huge profit
and April shows a huge loss.
The numbers appear erratic.
Finance corrects the mistake.
But the correction appears in yet another period.
Now the pattern looks even more unstable.
Managers lose trust.
FP&A analyses numbers that no one believes.
Responsibility accounting collapses into noise.
So what is the solution?
Top management asks a simple question.
Why not allow budget holders to review the draft accounts before they are published?
Let them drill into the numbers.
Let them challenge anything suspicious.
Let them suggest corrections.
And only then finalize the accounts.
Sounds simple.
But if you ask ERP vendors…
IT departments…
FP&A software vendors…
They will tell you:
It is expensive.
It is complicated.
It requires a major system implementation.
But the truth is…
there is a remarkably simple solution.
Using Excel.
First we export the General Ledger transactions.
Maybe 100,000 records.
Maybe more.
Normally those records would stay inside one spreadsheet.
And that spreadsheet would become yet another silo.
But instead…
we do something different.
A button in Excel creates a small database file on a shared drive.
Another button creates a table.
A third button uploads the GL transactions into that table.
Now the data is centralized.
Not inside hundreds of spreadsheets.
But in one shared data store.
Now look at this spreadsheet.
It is tiny.
About one hundred kilobytes.
There is no data stored in it.
Just a profit and loss template.
A shop number.
A period number.
And one button:
GET.
When the manager clicks that button…
the spreadsheet retrieves the draft accounts for that shop.
Instantly.
Now the manager can review the numbers before month end.
If something looks wrong, they click the number.
And immediately see the underlying transactions.
Perhaps a deposit for an exhibition that should belong in September.
They type a comment.
And press PUT.
That message goes directly to the finance team.
Another line looks suspicious.
A missing cost.
They flag that too.
Within minutes the finance team sees the comment.
They investigate.
They make the adjustment.
Later the manager refreshes their spreadsheet.
And sees the correction.
Satisfied, they mark their accounts Confirmed.
Multiply this by four hundred budget holders.
Every manager reviewing their numbers.
Every adjustment tracked.
Every correction verified.
Now the finance controller sees a dashboard.
Four hundred shops.
Each one colour-coded.
Not started.
In progress.
Confirmed.
When they walk into the boardroom…
the numbers are no longer disputed.
They have already been validated by the people who know the business best.
And here is the crucial transformation.
We started with hundreds of siloed spreadsheets.
Each one holding its own copy of the data.
Instead we now have:
One version of the truth.
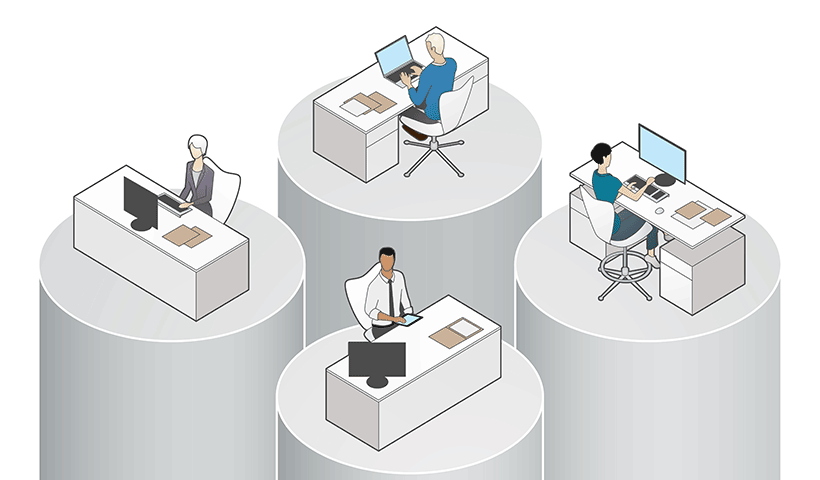
Hundreds of spreadsheets…
but none of them contain the data.
They are simply windows into the same shared system.
Six hundred people can use them simultaneously.
No conflicts.
No emailing files.
No reconciliation.
Everyone working from the same numbers.
The spreadsheet has stopped being a document.
And has become a client.
And the system doesn’t stop with Excel.
The same data can be accessed from:
Google Sheets.
Excel on the Web.
Mobile devices.
Power Apps.
Automation tools.
Even a simple web form can control deadlines for submissions.
All connecting to the same data.
All part of the same system.
So this is the real transformation.
From isolated spreadsheet documents…
to an open collaborative system.
Not replacing Excel.
But unlocking its true architecture.
The spreadsheet becomes the interface.
The data lives centrally.
And suddenly hundreds of people can collaborate…
in real time…
on the same version of the truth.


Add comment