
In this article, I’ll demonstrate how a single sheet in an Excel workbook can outshine even the most sophisticated ERP systems and cloud-based FP&A tools currently being promoted. You can build this in a matter of hours, whereas ERP systems that cost millions to set up will require many months to implement adjustments like this, and each adjustment costing millions.
Let’s dive into the scenario: this is the month-end accounts processing. We need budget holders—let’s say there are 100 of them—and 400 operating units (shops). We in the finance team need these budget holders to review their draft accounts and provide feedback on any necessary adjustments.
This one sheet is a standard profit and loss statement. The period is April, and the operating unit ID is 40001. When the user clicks “Get,” their profit and loss statement is populated. We want them to look over this month’s figures and identify any anomalies. If something seems off, like this entry here, they simply select that cell. On the right, a detailed listing appears, showing the transactions behind that number.
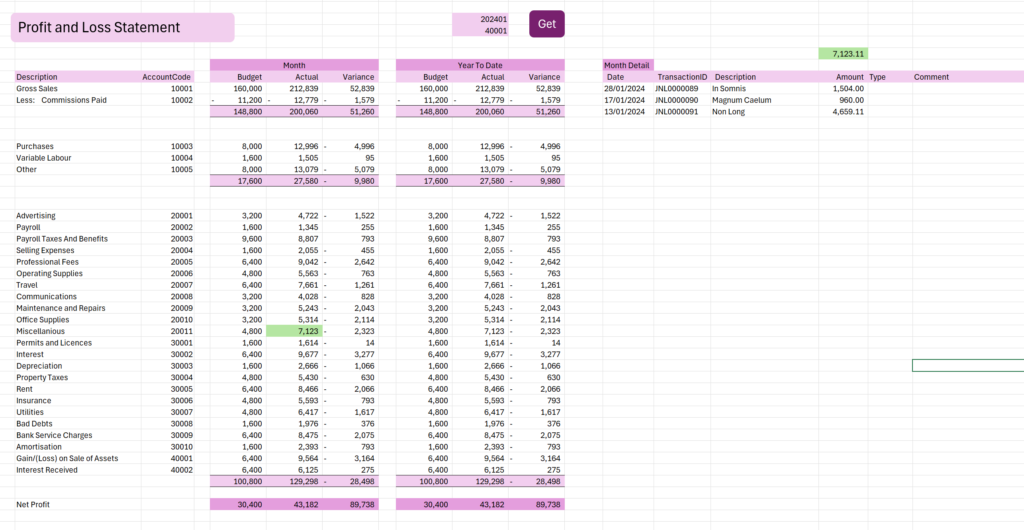
Now, let’s break down where the data comes from. There’s a budget table for the entire year, which populates the “Month Budget” and “Year-to-Date Budget” columns. This budget table remains static all year. Another table, the general ledger (GL), is refreshed from the ERP system. It provides the actuals for this month and year-to-date figures.
Both tables are stored in a centrally accessible location, not in this workbook. The same spreadsheet, a template, is used by all 100 budget holders, accessing the same data tables. The detail on the right also comes from the same GL table but at the transaction level. And this could be millions of transactions overall.
Budget holders can review the transactions, flagging any items they find unusual. They can add comments, for example, regarding accruals, prepayments, or adjustments that the finance team needs to be aware of. They might also suggest reallocating items to a different account or operating unit.
Once they’ve entered their comments, they click the “Put” button, which submits their feedback and closes the detail view. They can then proceed to review another account or operating unit. This seamless process allows budget holders to provide essential feedback quickly and efficiently.
The comments are uploaded to a central table, “Review Comments,” which consolidates all feedback from the 400 operating units and 100 budget holders. Ideally, we in the finance team get this feedback before finalizing accounts so adjustments can be made. Once adjustments are made, the budget holders can refresh their sheets to confirm the updates.
Most companies lack this feedback capability because implementing it in an ERP system would be prohibitively expensive. Traditional Excel methods, where the data is stored in the workbook, can’t achieve this. Here, we’ve simply moved the data typically kept in spreadsheets into centralized tables that all spreadsheets can access seamlessly.
Here’s something surprising: this solution uses only built-in capabilities of Excel. There are no external Add-Ins. Any spreadsheet in the world can use this functionality. If you know how, you can build this solution in hours—a solution that surpasses IT solutions costing millions, with months of budget approvals and lengthy implementations. With this approach, you could have it up and running the same day, or by Friday at the latest.
That’s the power of Excel—just a single sheet. Imagine creating this level of productivity in your company. What value would that create for the entire organisation? What would that make you? Think about it.
This is a podcast by Hiran de Silva. Narrated by Charlie. The video [TBA] is narrated by Paul.


Add comment